Memory pressure on Mac explained: green, yellow, red
What memory pressure means on a Mac, why full RAM is normal, how compression and swap work, and when yellow or red means you should act.
Memory pressure is macOS's measure of how hard it is working to keep everything you have open in memory. Green means it is coping easily, yellow means it is compressing a lot of memory to make room, and red means it is moving memory out to the disk and you will feel the Mac slow down. You find it at the bottom of Activity Monitor's Memory tab.
The most important thing to know is that a Mac with nearly all its memory "used" is normal and healthy. Memory pressure, not the used figure, is the number that tells you when to act.
Why "Memory Used" looks nearly full
Open Activity Monitor on almost any Mac and the memory used figure will be close to the total. That isn't a problem, it is the design.
Unused memory does nothing. So macOS keeps recently used files and app data in spare memory, labelled Cached Files, because reading from memory is far faster than reading from the disk. When an app needs more room, macOS drops some of that cache instantly. Apple says it plainly in its guide to checking whether your Mac needs more RAM: having unused memory doesn't necessarily make your Mac faster.
That is why apps that promise to "free up RAM" are no help. They force macOS to throw away the cache, so you see a bigger free number and then wait longer as apps reload what was thrown away.
How macOS makes room
When apps ask for more memory than is free, macOS works through a sequence, from cheapest to most expensive:
- Drop cached files. Cached data is a copy of something already on disk, so it can go immediately.
- Compress inactive memory. Memory belonging to apps you haven't used for a while is squeezed into a smaller space in RAM. Decompressing it later is quick, much quicker than reading from the disk.
- Swap to the disk. If compression isn't enough, macOS writes some memory out to swap files on the startup disk and reads it back when needed. The SSD in a modern Mac is fast, but it is still far slower than RAM, and this is when you notice lag.
Memory pressure is a summary of how far down that list macOS has to go. On Apple silicon Macs, the memory is shared between the processor and the graphics, which is why graphics-heavy work also shows up here.
Read the Memory tab in Activity Monitor
- Open Activity Monitor. Press Command-Space, type Activity Monitor and press Return, or find it in Applications > Utilities.
- Click the Memory tab.
- Look at the panel at the bottom of the window.
Apple's guide to viewing memory usage in Activity Monitor defines each figure. In plain terms:
| Field | What it means |
|---|---|
| Memory Pressure | The graph. How easily memory is keeping up with demand |
| Physical Memory | The total RAM in your Mac |
| Memory Used | Everything in use, split into the three lines below |
| App Memory | Memory your apps are actively using |
| Wired Memory | Memory macOS needs that can't be compressed or swapped |
| Compressed | Inactive memory that has been squeezed to save space |
| Cached Files | Recently used files kept in spare memory to speed things up |
| Swap Used | Memory written out to the startup disk |
What the colours mean
Apple describes the three colours this way:
- Green: memory is being used efficiently. You don't need more.
- Yellow: you might eventually need more memory. Keep an eye on it.
- Red: your Mac needs more memory for what you are doing.
Underneath, yellow usually means macOS is compressing heavily, and red means compression is no longer enough and it is leaning on swap.
Look at the shape of the graph as well as the colour. A short yellow spike while you export a video or open a huge file is normal. A graph that sits in yellow or red while you are doing everyday things is the signal to act.
Swap Used: read it with pressure, not on its own
A few hundred megabytes, or even a few gigabytes, of swap with a green graph is normal. macOS moves memory that hasn't been touched for a long time out of the way to keep RAM free for active work. It only matters when swap keeps growing while the graph is yellow or red. That means memory is being written to the disk and read back constantly.
Check memory from Terminal
These commands only read. They are handy for a quick look or for checking a Mac remotely.
memory_pressure
Run it exactly as shown, with no options. It prints page statistics and finishes with a line like System-wide memory free percentage: 47%. Higher is better. Warning: don't add options. memory_pressure -l and memory_pressure -p deliberately use up memory to simulate pressure, which slows your Mac down while they run.
sysctl vm.swapusage
Prints how much swap exists and how much is in use, for example total = 6144.00M used = 4760.19M free = 1383.81M (encrypted). macOS creates and removes swap files as it needs them, so the total changes over time.
top -l 1 -o mem -n 10 -stats pid,command,mem,cmprs
Lists the ten processes using the most memory, with how much of each is compressed. The PhysMem line in the header gives a summary: used, wired, compressor and unused.
vm_stat
Prints raw page counts. The first line tells you the page size, which is 16,384 bytes on Apple silicon. Multiply a page count by that number to get bytes. It is useful mostly for spotting trends, such as compressions and swap-outs climbing quickly.
What to do when pressure is yellow or red
Work through these in order. Most of the time the first one or two are enough.
- Find the biggest apps. In Activity Monitor's Memory tab, click the Memory column heading so the largest sit at the top.
- Quit what you don't need. Select an app, click the Stop button (the X in a circle) in the toolbar and choose Quit. Quit lets it save. Use Force Quit only for an app that has stopped responding, because unsaved work is lost.
- Tame the browser. Each tab is its own process, so a browser with many tabs is often the biggest user of memory on the Mac. Close what you aren't reading and bookmark the rest.
- Look for an app that keeps growing. If one app's memory climbs steadily over hours while you do the same thing, it is probably leaking memory. Quitting and reopening it gives the memory back. An update may fix it for good.
- Restart. If your Mac has been up for weeks, a restart clears swap and gives every app a clean start.
- Trim background helpers. Apps that start at login hold memory all day. The guide to removing login items on Mac shows what is safe to switch off.
- Keep disk space free. Swap lives on the startup disk. If the disk is nearly full, macOS has less room to swap and everything gets slower. See how to free up space on Mac.
If the Mac still feels slow with a green graph, memory isn't the cause. Check the processor, disk space and heat in why your Mac is slow.
Do you need more memory?
You need more memory when pressure stays yellow or red during your normal work, with only the apps you actually use open, and the steps above don't change it. Occasional red during a big job isn't enough reason on its own.
On Apple silicon Macs, memory is part of the chip and can't be upgraded later, so this is a decision for your next Mac. To check what your current one has, hold the Option key, choose Apple menu > System Information and click Memory. If there is no memory slots section, the memory can't be upgraded.
When you buy your next Mac, glance at Swap Used and the pressure graph during your busiest day. That tells you more about how much memory you need than any general advice.
Is swap bad for the SSD?
Swap does write to the SSD, and SSDs have a finite write life. Occasional swap is part of normal use and nothing to worry about. Heavy swap every day is a sign the Mac is short of memory for your workload, and you will notice the slowdown long before you need to think about the drive.
Memory pressure at a glance
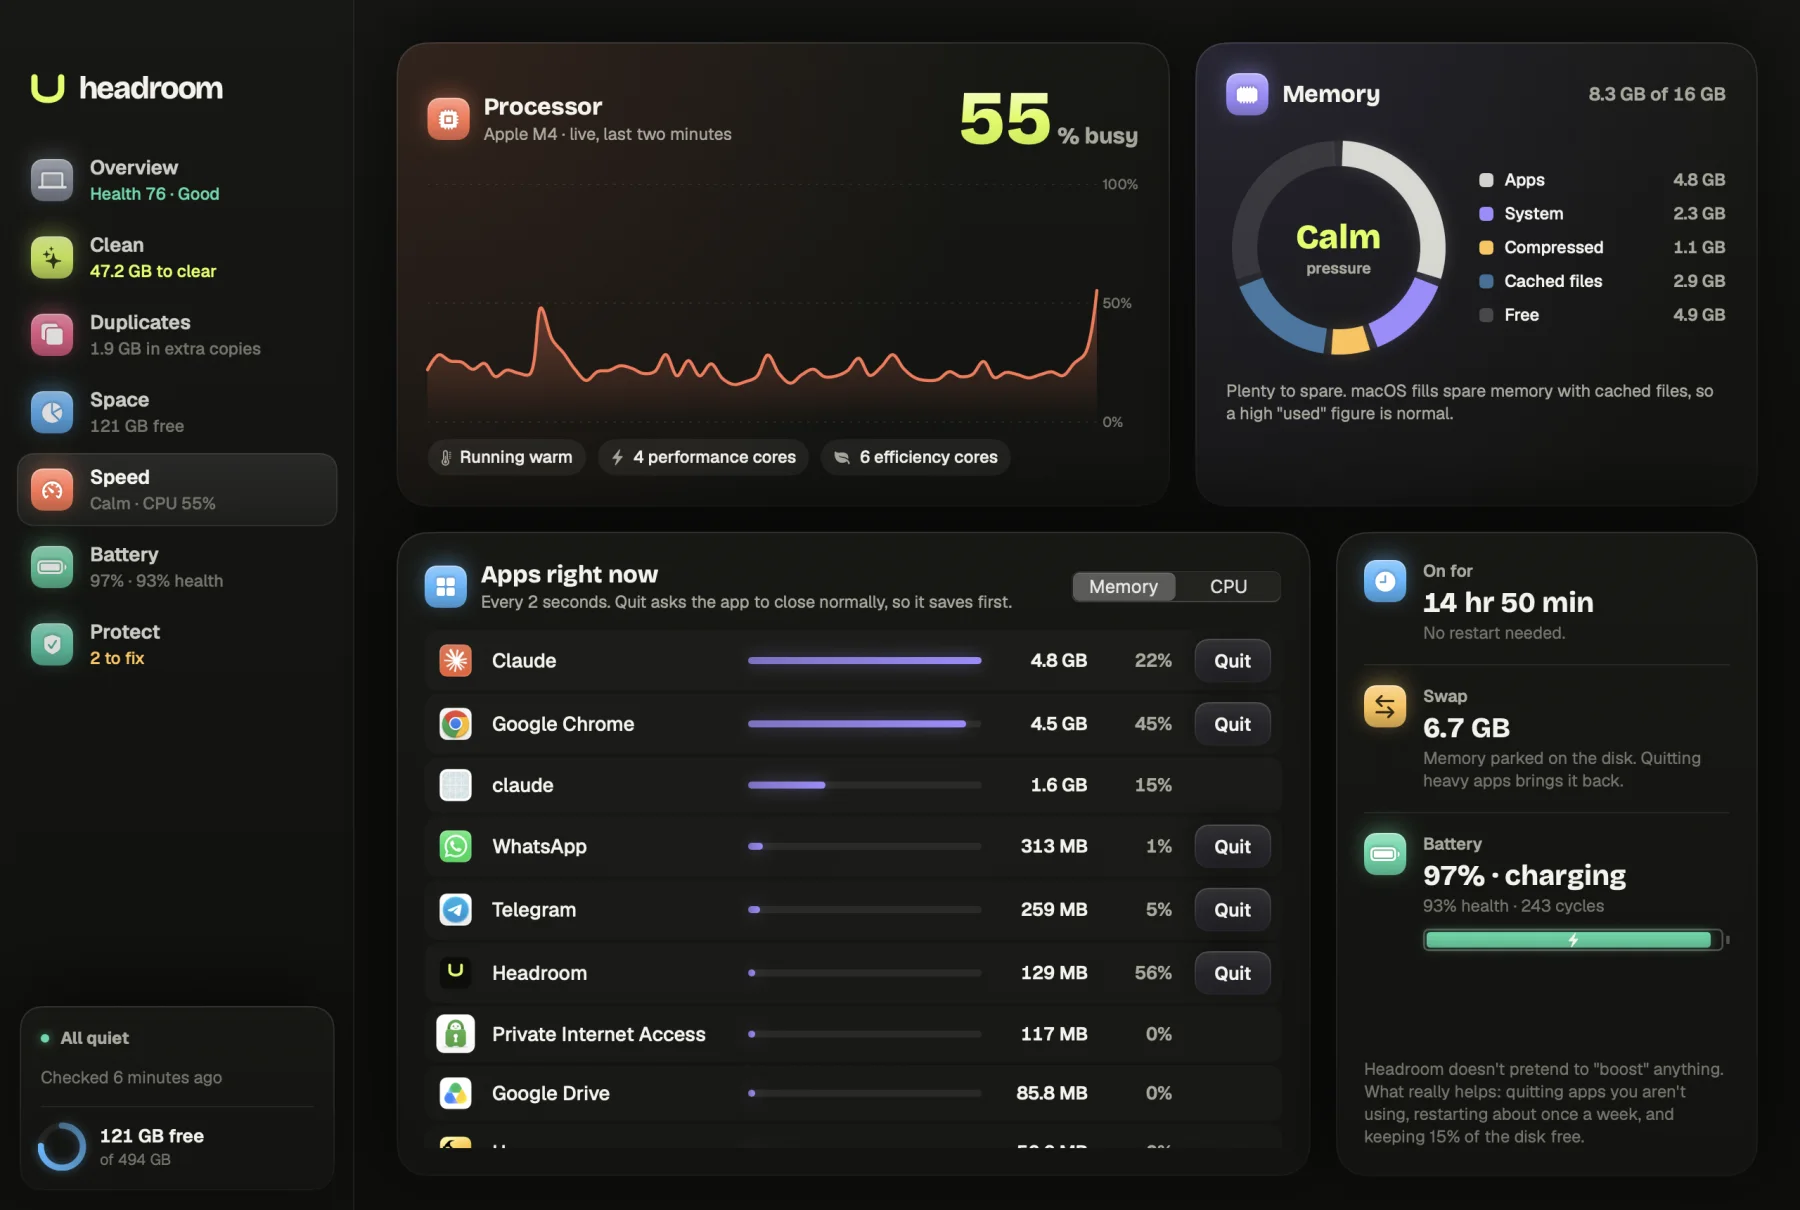
Headroom's Speed screen shows memory pressure in plain words, worked out from the same free-memory figure that memory_pressure reports, plus swap, live CPU use, and the apps using the most memory or CPU, each with a Quit button that asks it to close normally so it saves first. It refreshes every two seconds, so you can watch the pressure drop as you close things.
The Speed screen is part of the free download. The $19 one-time licence, for up to three Macs, adds the clean-up actions elsewhere in the app, such as clearing caches when a full disk is limiting swap. See the price or download Headroom.
Questions
What is a normal memory pressure on a Mac?
Green. A green graph means macOS is serving your apps from memory comfortably, even if Memory Used looks close to the total. Short yellow spikes during heavy work are fine too.
Is it bad that my Mac is using almost all of its RAM?
No. macOS deliberately fills spare memory with cached files so apps and documents open faster, and it gives that memory back the moment an app needs it. Memory pressure, not Memory Used, tells you whether there's a problem.
Why is my Mac using swap when memory pressure is green?
macOS moves memory that hasn't been touched for a long time out to the disk to keep RAM free for active work. Some swap with green pressure is normal. Swap that keeps growing while pressure is yellow or red means you're short of memory for what's open.
How do I reduce memory pressure on my Mac?
Sort Activity Monitor's Memory tab by the Memory column and quit the largest apps you aren't using, close browser tabs you don't need, and restart if the Mac has been up for a long time.
Can I add more RAM to my Mac?
Not on Apple silicon Macs, where memory is part of the chip. Some older Intel Macs have upgradeable memory. Hold Option, choose Apple menu > System Information and look under Memory to see what yours has.